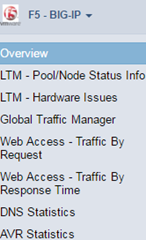
Quite recently appeared BIG-IP F5 Management Pack for VMware Log Insight, this solution can give insight into the traffic on the Virtual Servers to the people that normally do not have access to the interface of BIG-IP (and not only for them). As we know, BIG-IP includes a module Analytical Application Visibility and Reporting (AVR), this module collects all the necessary statistical information and it is required to send information to the VMware Log Insight. Information in the dashboard are grouped as follows:
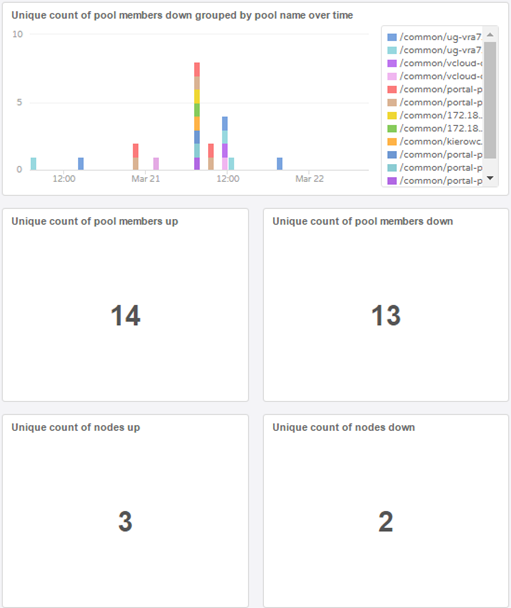
General view shows errors in access to the BIG-IP, tmm process errors and other (mostly empty). Next is an overall view of the status of individual members in the pools. This is very interesting information which simply do not get with the AVR. Often member disconnection from the pool can mean problems with the network or the server (node) and it is worth to look at them closer.
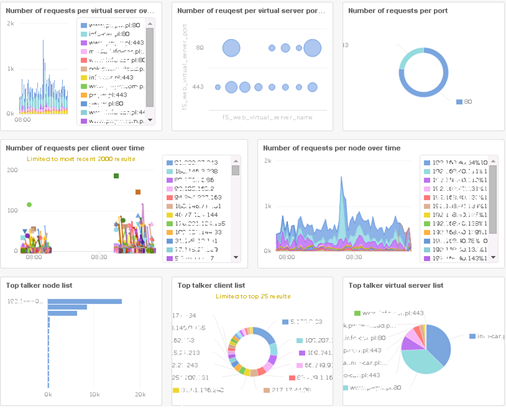
Another interesting view is the Web Access – Traffic By Request. This view will catch the busiest pool members and check what Virtual Server is the most “talkative”. In addition we check client requests, and we can go in the “Interactive Analytics” and see exactly what is happened.
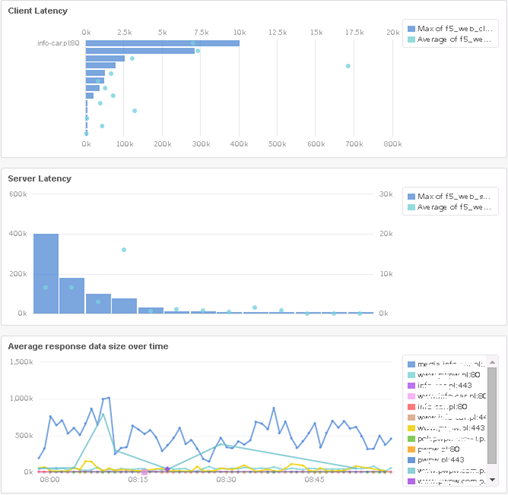
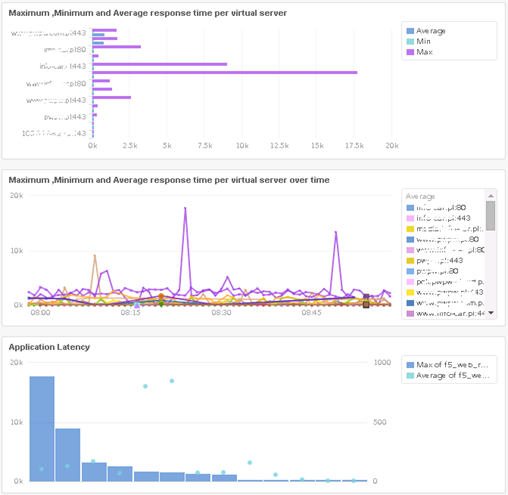
In view Web Access – Traffic By Response Time we check the response broken down into servers, applications, client and the size of response over time.
With each piece of information we can go into analysis mode and check what exactly has happened in the time of the selected object.
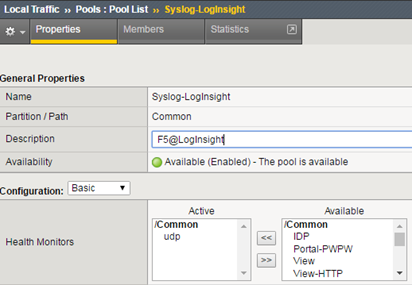
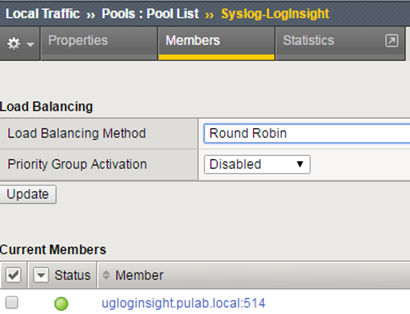
Other views are AVR/GTM module statistics and operations on the DNS server. Sorry I do not have an active GTM module so I will not show this information here. I personally miss most of the statistical information from the ASM, I hope that in future versions of the Management Pack will also Dashboards showing attacks on individual VS. Installation of BIG-IP F5 Management Pack in VMware Log Insight is standard and requires no additional configuration. On the BIG-IP we must meet a number of conditions and follow a few steps. Start by creating a pool which is a Log Insight member:
If you use a Log Insight cluster is a need to provide the IP address common to the entire cluster.
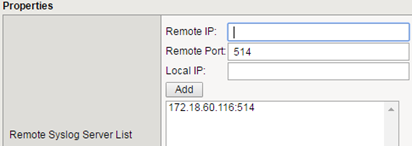
Then, in the System-> Logs-> Configuration-> Remote Logging add Log Insight as a syslog server.
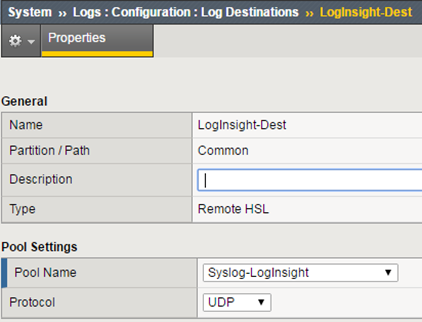
In the Log Destination create two configurations, one to Remote HSL (High Speed Logging) indicating the pool we created earlier.
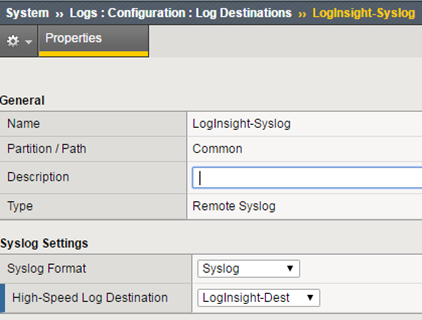
The second is the standard syslog with an indication of our established HSL.
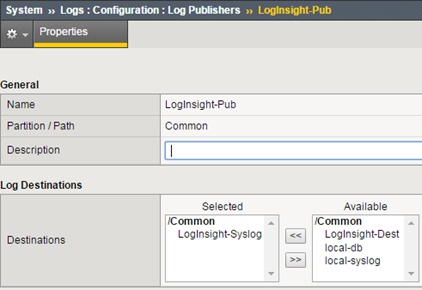
Then we create a new Log Publisher that will send logs to created by us Log Destination (syslog).
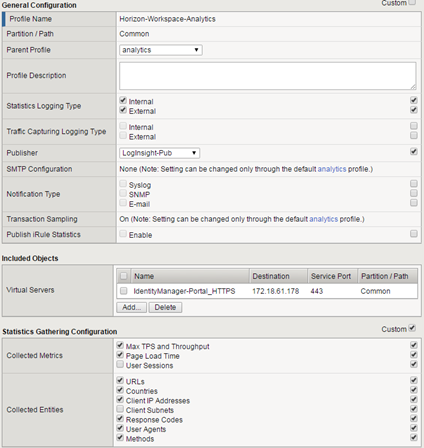
Send logs from the VS does not take place globally, for each server that interests us we must create a separate configuration. As already mentioned, the AVR module is required, therefore, we start by creating (or configuring existing) analytics profile. In this profile we select Logging Type as External (and Internal for AVR) and choose created by us Publisher. Profile strapped into the interesting Virtual Server.
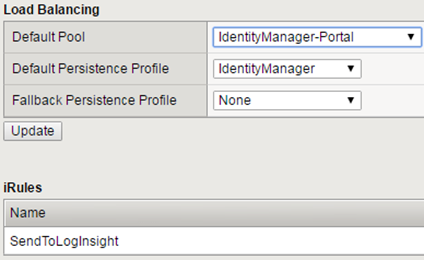
This is not the end of the configuration, along with the BIG-IP Management Pack is supplied iRule that we need to hook in the Virtual Server. Contrary to what is written in the documentation, the name of the iRule and the name of the pool and node member may be any, important is that in the iRule was given the correct pool name. iRule looks like this:
# =============================
# iRule: logInsight_iRule_http START
# ==============================

when CLIENT_ACCEPTED {
    set client [IP::client_addr]
    set client_req_start_time [clock clicks -milliseconds]
}

when SERVER_CONNECTED
{
     set server_req_start_time [clock clicks -milliseconds]
}

when HTTP_REQUEST_SEND
{
    set http_req_send_start_time [clock clicks -milliseconds]
    set node_elapsed_time [expr {$http_req_send_start_time - $server_req_start_time}]

}

when HTTP_REQUEST {

    set client_latency [expr {[clock clicks -milliseconds] -  $client_req_start_time} ]
    set vhost [HTTP::host]:[TCP::local_port]
    set url [HTTP::uri]
    set method [HTTP::method]
    set http_version [HTTP::version]
    set user_agent [HTTP::header "User-Agent"]
    set tcp_start_time [clock clicks -milliseconds]
    set req_start_time [clock format [clock seconds] -format "%Y/%m/%d %H:%M:%S"]
    set req_elapsed_time 0
    set virtual_server [LB::server]

    if { [HTTP::header Content-Length] > 0 } then {
        set req_length [HTTP::header "Content-Length"]
        if {$req_length > 4000000} then {
            set req_length 4000000
        }
        HTTP::collect $req_length
    } else {
        set req_length 0
    }

    if { [HTTP::header "Referer"] ne "" } then {
        set referer [HTTP::header "Referer"]
    } else {
        set referer -
    }
}


when HTTP_RESPONSE {

    set hsl [HSL::open -proto TCP -pool Syslog-LogInsight]
    set resp_start_time [clock format [clock seconds] -format "%Y/%m/%d %H:%M:%S"]
    set node [IP::server_addr]:[TCP::server_port]
    set status [HTTP::status]
   set req_elapsed_time [expr {[clock clicks -milliseconds] - $tcp_start_time}]
    set server_latency [expr {[clock clicks -milliseconds] -  $server_req_start_time} ]

    if { [HTTP::header Content-Length] > 0 } then {
        set response_length [HTTP::header "Content-Length"]
    } else {
        set response_length 0
    }

   HSL::send $hsl "<190>f5_web_access_info|$vhost|$virtual_server|$client|$method|\"$url\"|HTTP/$http_version|$req_start_time|$req_length|$req_elapsed_time|$node|$status|$resp_start_time|$response_length|$user_agent|$client_latency|$server_latency|\"$referer\"\r\n"
}
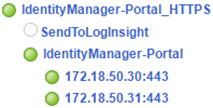
In my case, I called her SendToLogInsight and strapped her to interesting me VS.
If you have all the necessary components, install and configure the entire set. It provides a really interesting information and opportunities to analysis, benefit from it so for BIG-IP and VMware Administrators and for those who are responsible for individual applications.


3 Comments
Leave a reply →